
In 2025, DCImanager strengthened its position as a reliable tool for data center infrastructure management. When developing the product, we relied on real market challenges and audience demands. Last year, our team focused on making the platform a more comprehensive and accurate reflection of data center infrastructure: from inventory and storage system management to server and operating system monitoring.
There were many important releases! Storage systems and inventory management tools have become global development tracks. Over the course of the year, we strengthened diagnostics, expanded the server card, and made the platform more adaptable to specific operating scenarios.
Infrastructure and inventory management
Storage accounting and monitoring
In 2025, we took an important step in developing DCImanager as a platform for physical IT infrastructure management – we added a module for working with data storage systems. Now DCImanager can be used to keep track of storage systems in racks and warehouses, as well as to track their switching between each other and with other server equipment. Monitoring metrics are collected from the most common types of storage systems used by clients and taken to the built-in Grafana. In 2026, we plan to actively expand the list of supported types.
The storage module allows you to connect to the platform:
- storage system chassis – data storage system cases in which all components are installed;
- controllers – servers or sets of processor boards;
- I/O modules – network adapters or sets of ports. Provide physical ports for storage system connection to the network;
- disk drives;
- power supply units.
The storage module is available for the Infrastructure version, and also if the inventory management module is enabled in the platform. In the nearest future, we plan to expand the platform with new types of storage systems – follow the updates!
Managing the inventory installed from the back of the rack
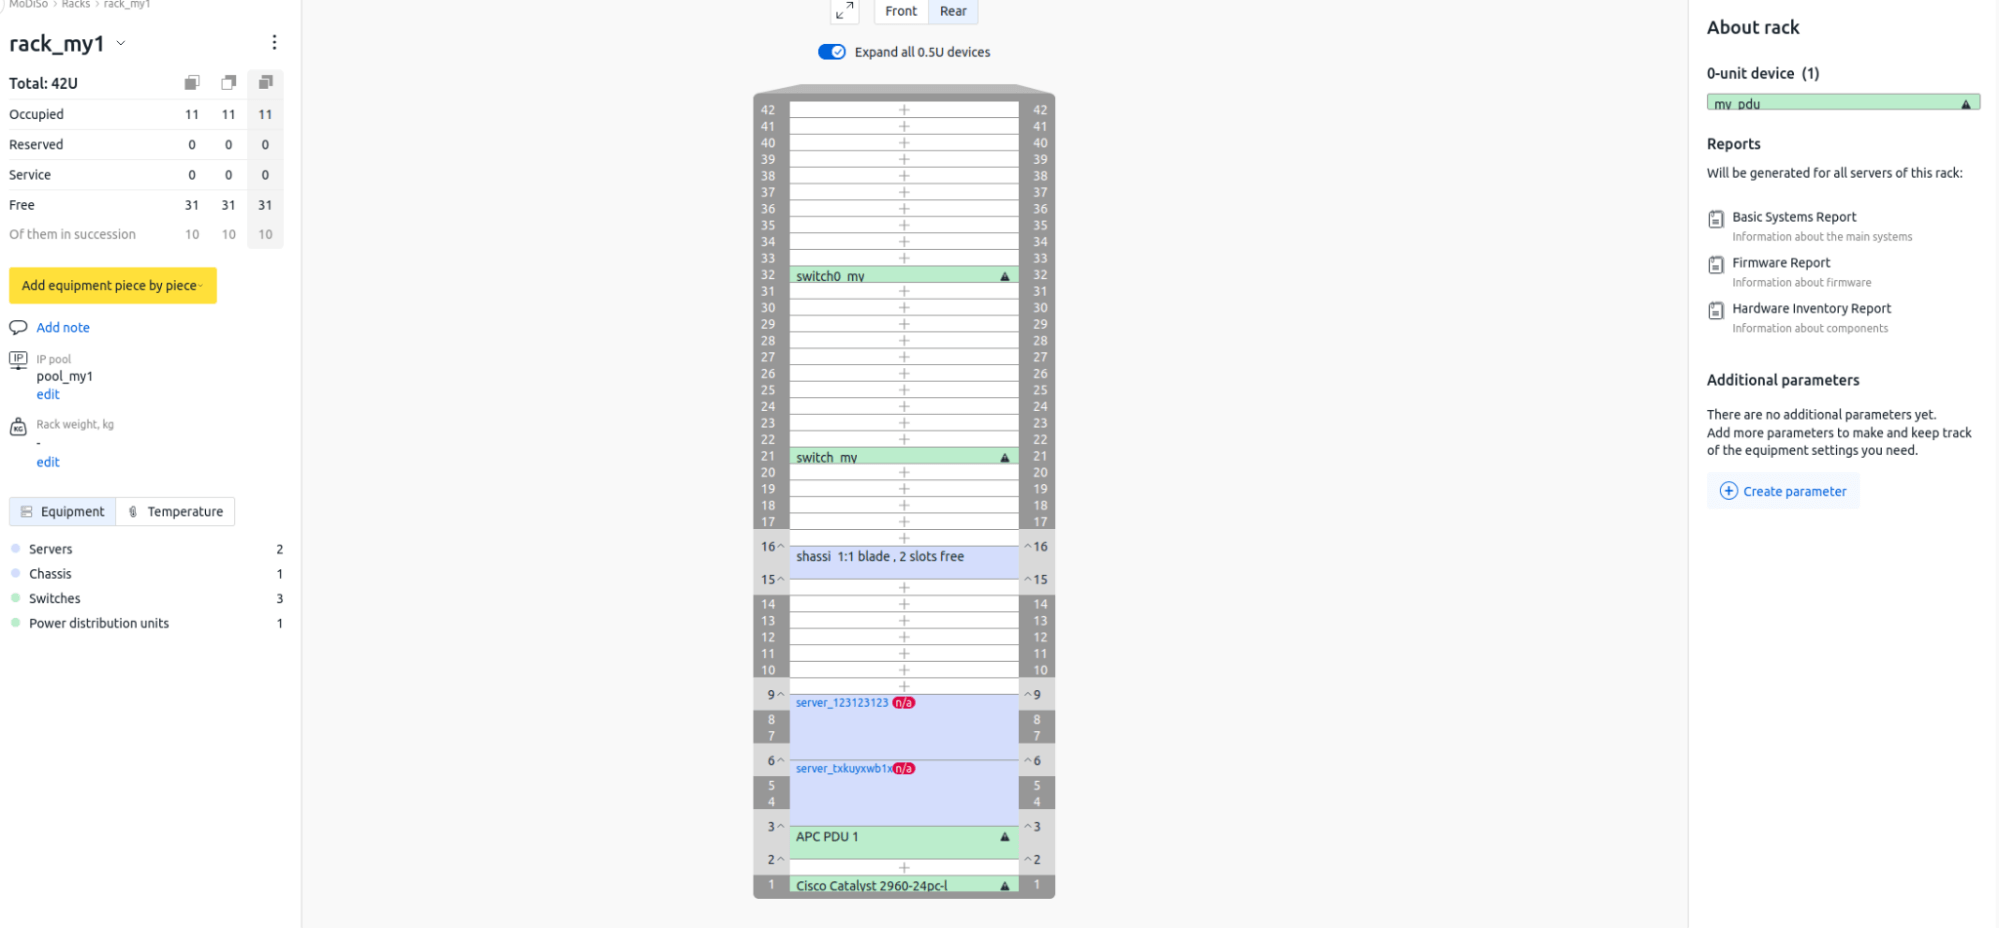
We concluded 2025 with a major update aimed at strengthening inventory management tools. Now you can plan how the inventory will be placed in the unit – whether it will occupy the entire depth or will be installed only on one side. This information is displayed on the rack card and helps you plan the placement more efficiently.
A guide to the new feature is the rack visualization module, which displays a rack map graphically and allows you to see:
- inventory placement;
- number of devices of a certain type;
- number of free, occupied and reserved units;
- rack-bound devices;
- rack occupancy percentage;
- temperature of servers in the rack.
This new feature is useful in scenarios when devices are placed on both sides of a unit to save space, or when it is important to consider the installation side for proper installation and maintenance. This function is also relevant when a part of the unit is leased if one side is free.
Approaching conventional monitoring systems and status tracking
Displaying the log archive in the server card
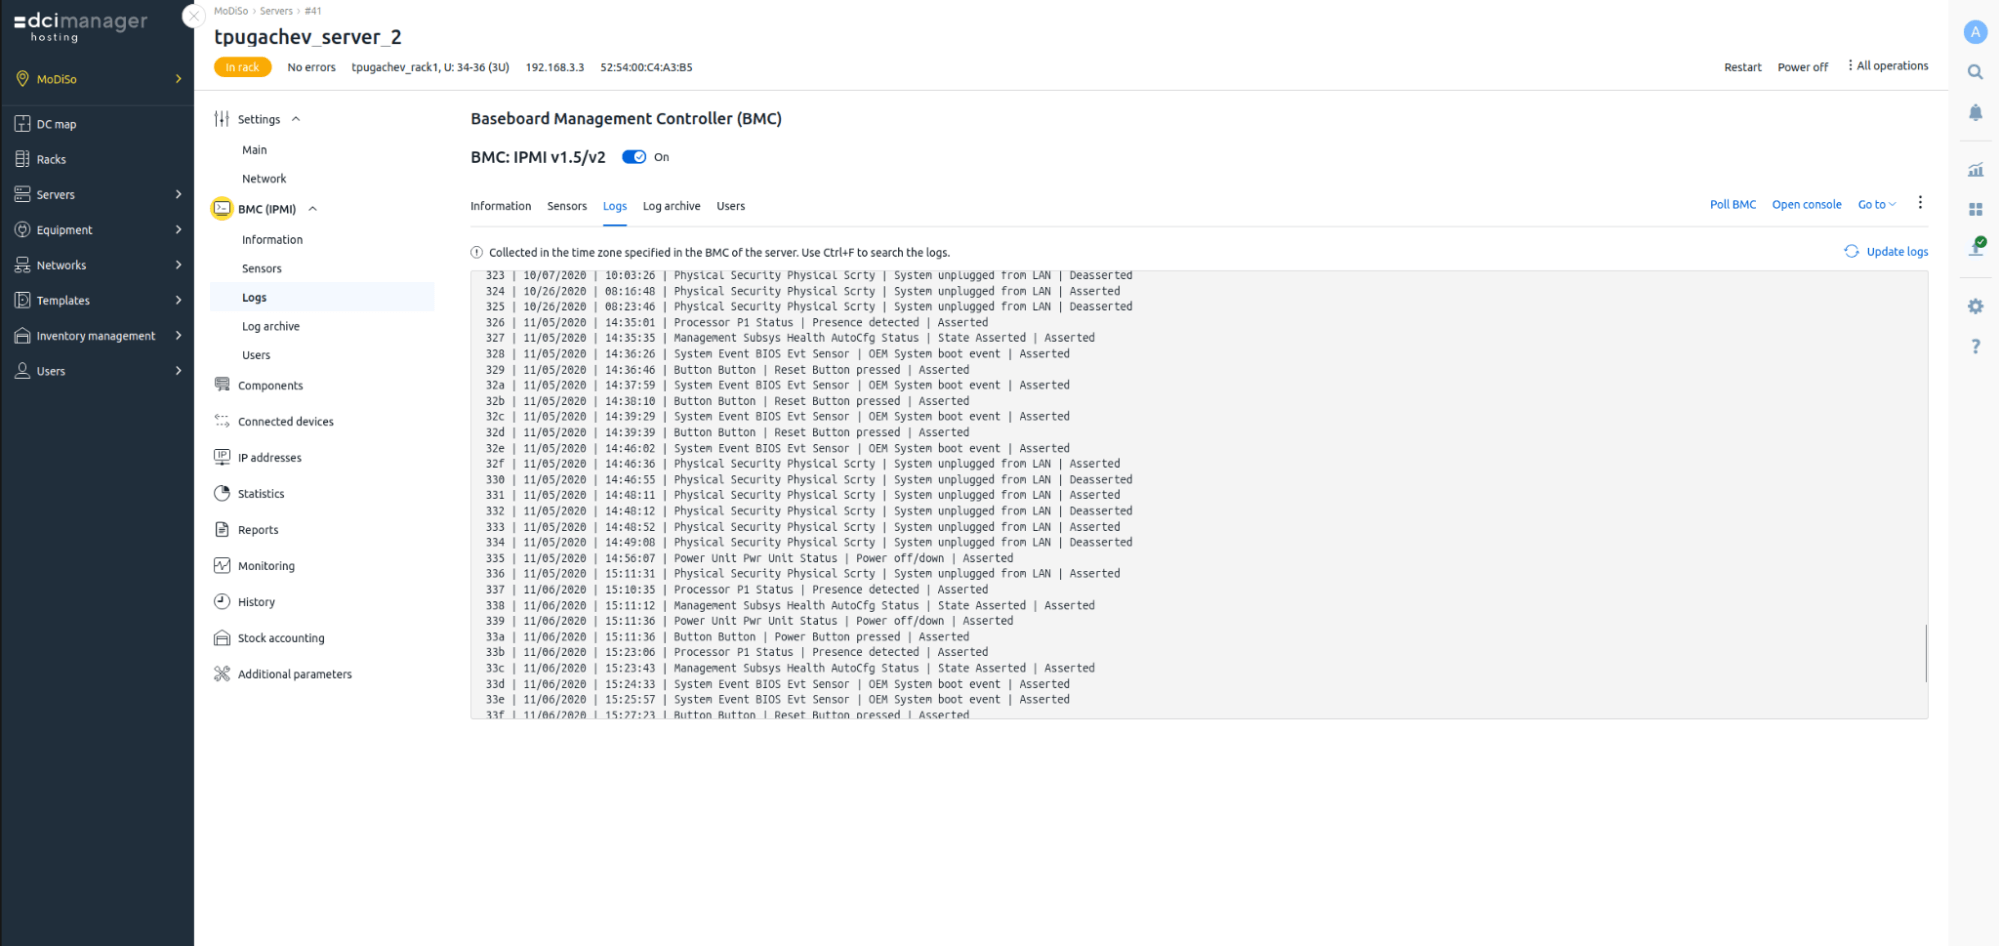
Last year, we paid a lot of attention to developing system status monitoring capabilities. To speed up diagnostics and simplify troubleshooting, we have added a "Log archive" tab to the server card.
You can view the latest BMC (Baseboard management controller) log files in the Logs tab, which displays records of the last successful BMC poll. Displaying up-to-date and archived logs in a single interface speeds up diagnostics and troubleshooting if the server is unavailable.
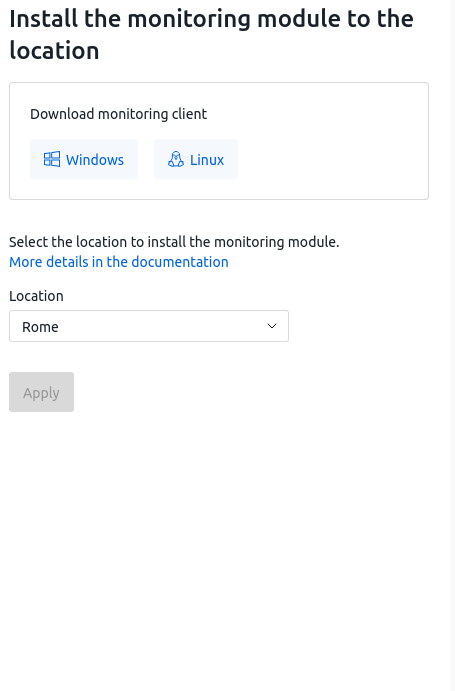
Windows OS Agent and OS metrics in the server card
We have devoted a significant amount of work to expanding the functionality of “Server monitoring using the OS agent” module, which provides server OS metrics. They contain information about the operation of the CPU, RAM, disks, network and system processes.
The operating system agent is compatible with popular Linux distributions and Windows-family operating systems. All agent monitoring data and graphs are available in the server card, without switching to Grafana. The administrator can see the current state of the infrastructure in a single platform interface.
Expandability and integration
Creating and adding your own hardware handlers
In 2025, DCImanager added the ability to create and connect custom processing modules for BMC, switches, and power supply units. Thanks to templates and expandable architecture, the platform allows you to you can connect processing modules for servers, switches, and other active hardware. This gives system integrators and hosting providers the ability to quickly and independently adapt DCImanager to their infrastructure and operational scenarios.
Processing modules for BMC or switches are written in Python and added directly to the platform – you need to create the processing module code and upload it to DCImanager.
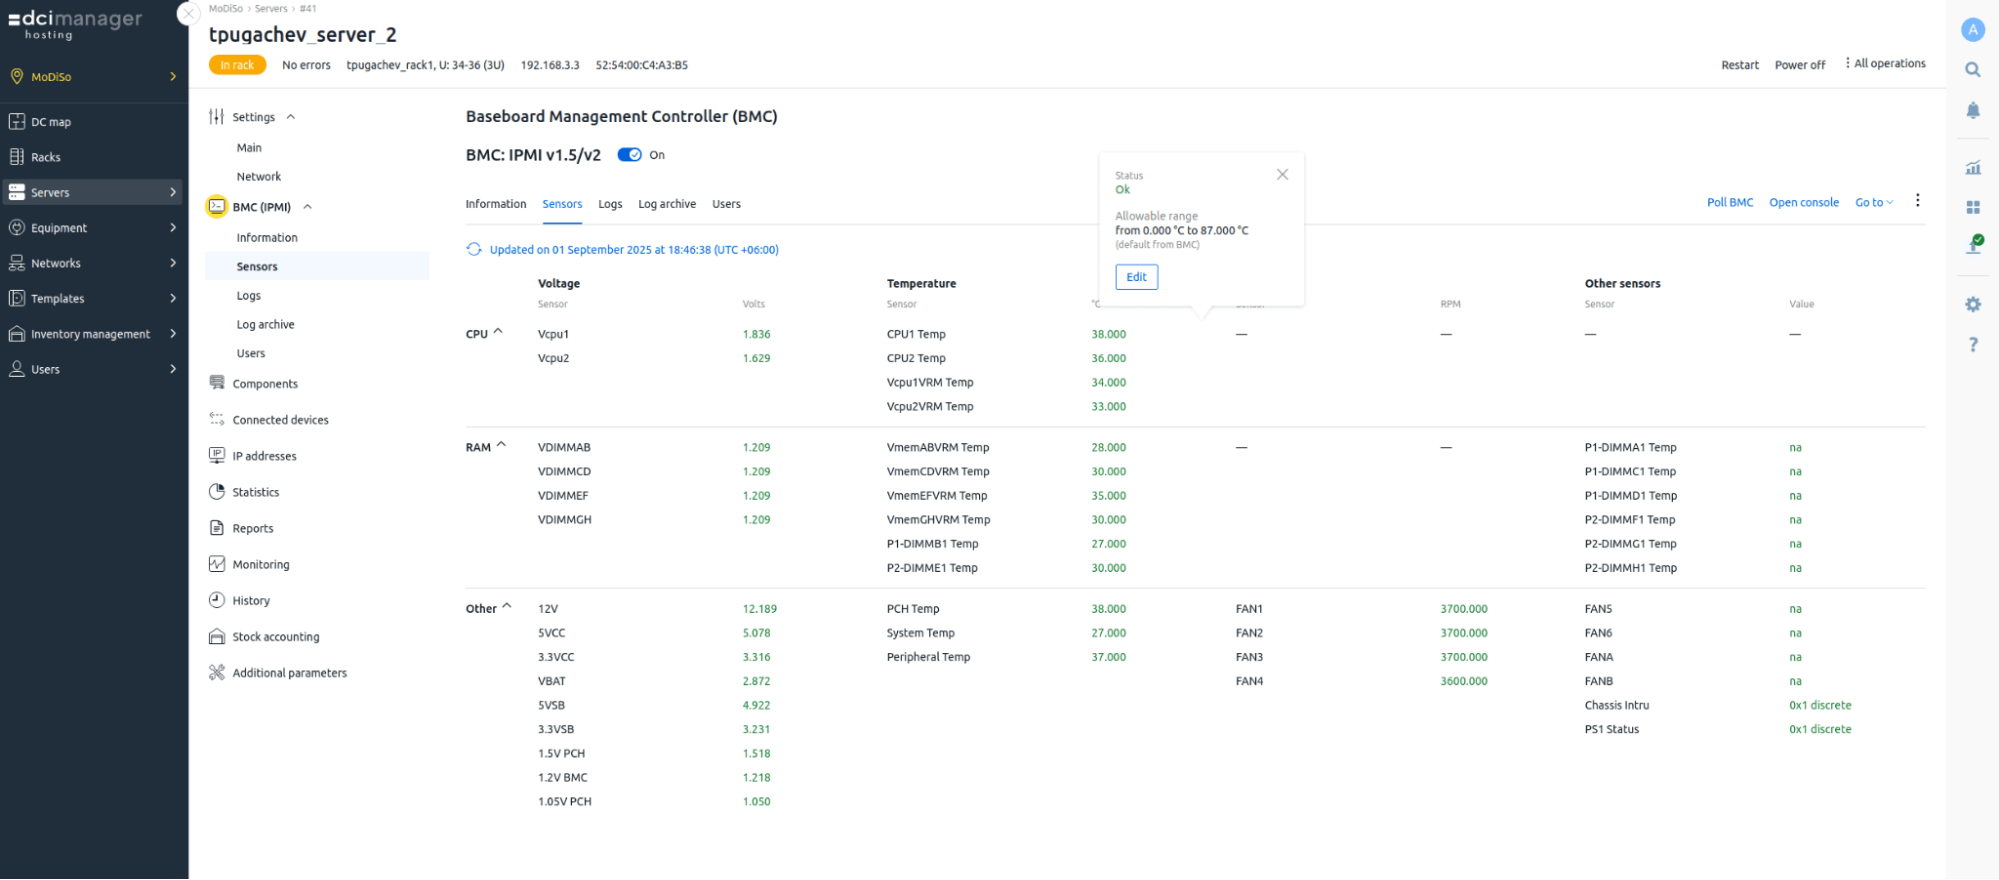
Customizing the notification thresholds for server sensors
We have added the ability to configure notification threshold values for server sensors. This allows you to have a flexible configuration of monitoring parameters and notification threshold values for specific operational scenarios.
This option is especially relevant for system administrators who do not have enough vendor pre-set sensor thresholds, such as temperature, power supply or fan speed, as well as for infrastructures with high ventilation/voltage demand.
Developing the tools for migration from other systems
Importing equipment from a CSV file
In 2025, we expanded the tools for importing information and bulk data entry in DCImanager. The platform now supports equipment importing from CSV files – it is now possible to batch-add data on servers with different BMC access details, without creating each one manually.
This feature simplifies not only the migration of data from other systems, but also the commissioning of large batches of hardware, allowing for the rapid connection of infrastructure during large-scale deployments. In the “Equipment import” section of the settings, you can upload file containing information about locations, the hardware itself, and device access parameters.
Plans
This year, the DCImanager team will focus on developing key capabilities that shape the platform as a flexible data center infrastructure management tool. We will continue developing our proprietary hardware processing modules to enable users to connect new hardware quicker and adapt the platform to their specific operating scenarios.
A separate track will be the development of a containerized delivery model with Kubernetes. At the same time, the team's key focus is developing the platform's network and hardware capabilities – SNMP Traps support will enhance monitoring, and the introduction of a visual network diagram will make working with the infrastructure more clear and predictable.
Special attention will be paid to the development of the data storage ecosystem – FC and storage networks. New functionality will allow DCImanager to more accurately reflect the real-world data center landscape and manage servers, networks, and storages as a unified system.


