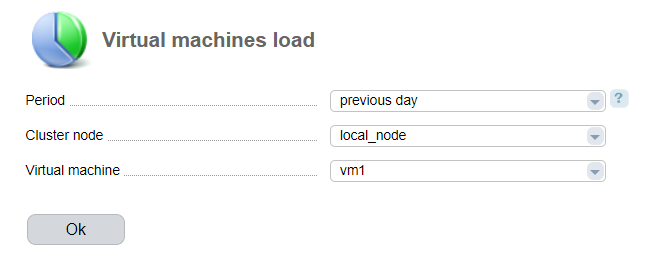
Navigate to Statistics→ Cluster load.
Generate a report

- Period — select a period:
- previous day;
- current day;
- current week;
- current month;
- current year;
- previous week
- previous month;
- previous year;
- week;
- month;
- quarter;
- half-a-year;
- year;
- any period;
- the whole period.
- Cluster nodes — select a cluster node to display the statistics.
Statisticsis collected for the following parameters:
- outgoing traffic, GiB;
- incoming traffic, GiB;
- CPU time, sec;
- IOPS;
Per-minute statistics is kept for 5 days. Per-hour statistics is kept for one month and 3 days. Per-day statistics is kept for 2 years. When the specified periods expire, the data will be deleted.
Graphs for a random period are generated based on a per-hour statistics.
How to generate a network traffic report
To generate the report, go to Management → Virtual machines → select the virtual machine → Bandwidth.
The report displays graphs for the following data:
- cost and threshold of incoming traffic over the day, Kbps;
- cost and threshold of outgoing traffic over the day, Kbps;
- speed of incoming traffic detailed by day, Kbps;
- speed of outgoing traffic detailed by day, Kbps.
Traffic threshold is average consumption of speed. To calculate this parameter, VMmanager:
- Calculates the average traffic speed each five minutes.
- Discards 5% peak values obtained. The maximum value of the remaining will be the traffic threshold.
How statistics is collected
Raw statistics is kept in the file /usr/local/mgr5/var/stat/raw/mainstat/@VM_NAME/YYYYMMDDHH.stat (where VM_NAME is a virtual machine name) and is updated every 5 minutes. Once an hour the control panel resets raw statistics and deletes it from the directory.
 En
En
 Es
Es