

Monitoring has long reached the level of more than simply keeping track of your physical equipment. Virtualization has become a popular tool. Virtual networks and servers are cheaper than physical ones, easily scalable and help to save the company’s resources. Professionals use virtual machines for any tasks related to the delivery of an isolated service. For example, for testing code, graphic design, document management, website development and many others.
To build an effective monitoring system, let us define the typical infrastructure of an average enterprise. On average, it includes the following:
- one or more clusters of physical servers,
- hypervisor and software on the servers,
- network storage,
- several network segments,
- IP pools,
- user access and permissions system,
- several virtual machines with guest OS.
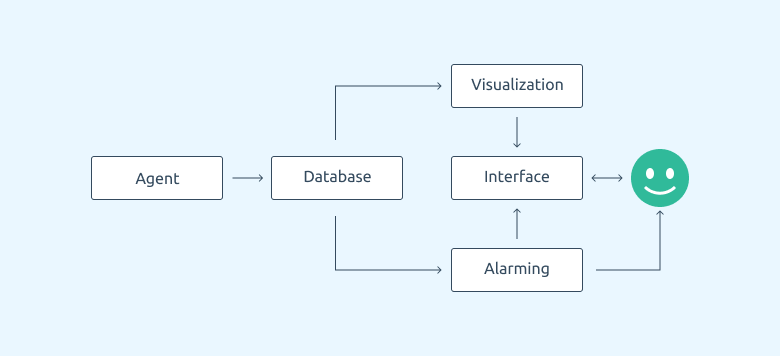
Multi-component systems often have to be used to monitor such different entities. For example, systems like this:
It is not an easy task to assemble all the components in one system and coordinate with the architecture. And it is not just about technical difficulties. The company will need specialists who:
- Know how to maintain and monitor physical equipment.
- Understand the peculiarities of virtual infrastructure operation and monitoring.
- Understand how to organize monitoring of services that support this infrastructure.
- Know how these services interact with each other.
- Have experience working with the chosen stack of technologies, or the company should be ready to invest time and money in training of experts.
- Know the specifics and understand the nuances of the company's business processes.
- Understand well the IT architecture of the company (or a specific project).
- Know the development strategy of that project.
Are you beginning to get the idea what level of specialists are needed? However, IT systems are constantly growing and require more and more company resources. Soon you may need a second, then a third and fourth staff member. In addition, later the need for the whole department of DevOps specialists, engineers and analysts will become evident. And all this is required in order to effectively monitor the IT infrastructure.
However, is it worth inventing the wheel when there is a ready-made solution out-of-the-box?
A ready-made monitoring system in VMmanager
VMmanager is a platform for building virtual infrastructure with a ready-made monitoring system, which includes a set of elements.
The metrics collection agent receives data from virtual and physical machines and then transmits them to statistics, real-time monitoring services, and alarms (to track peak indicators).
The notification service monitors all events in the platform database: creating, deleting or editing of data.
The platform self-diagnostic services monitor the master node metrics and events from the notification service.
Time-series database (Graphite) to store statistics.
Fast KV storages (consul/redis) for short-term information about notifications and alerts.
Visualization — an elegant and user-friendly interface for real-time monitoring and displaying statistics for a selected period.
Interface
Lists of virtual machines and nodes
In the list of virtual machines, you can see information about key parameters of VMs in real time and quickly assess their status.
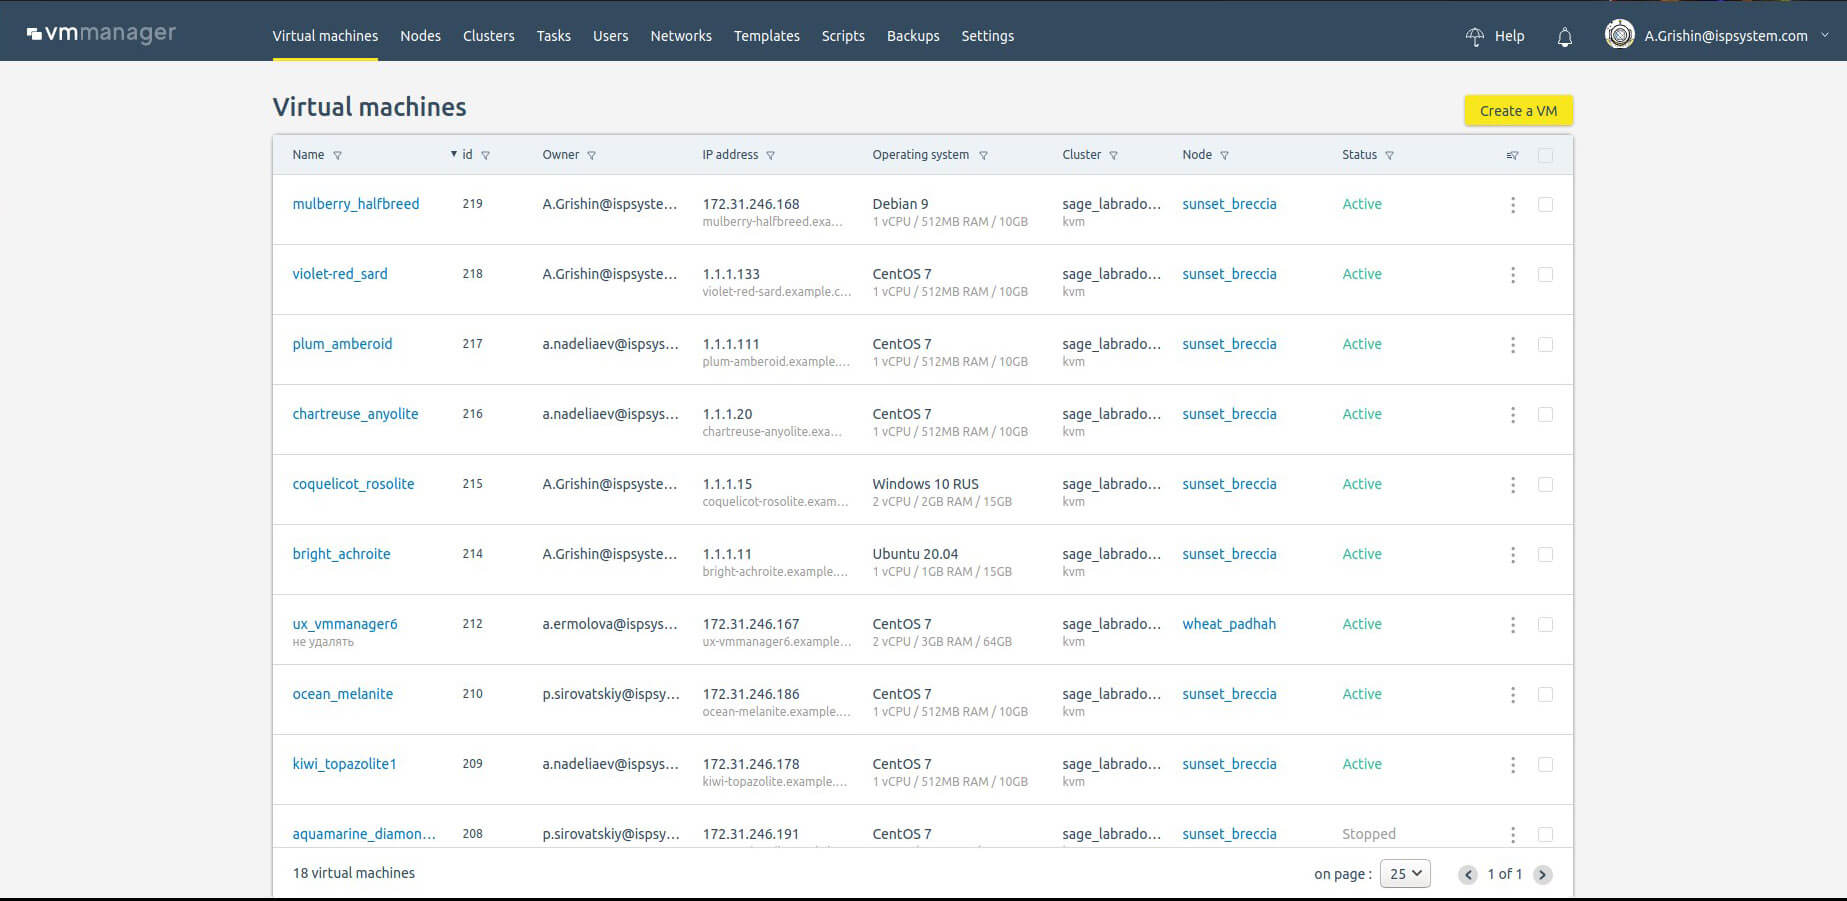
Similar information is available for physical servers in the list of nodes.
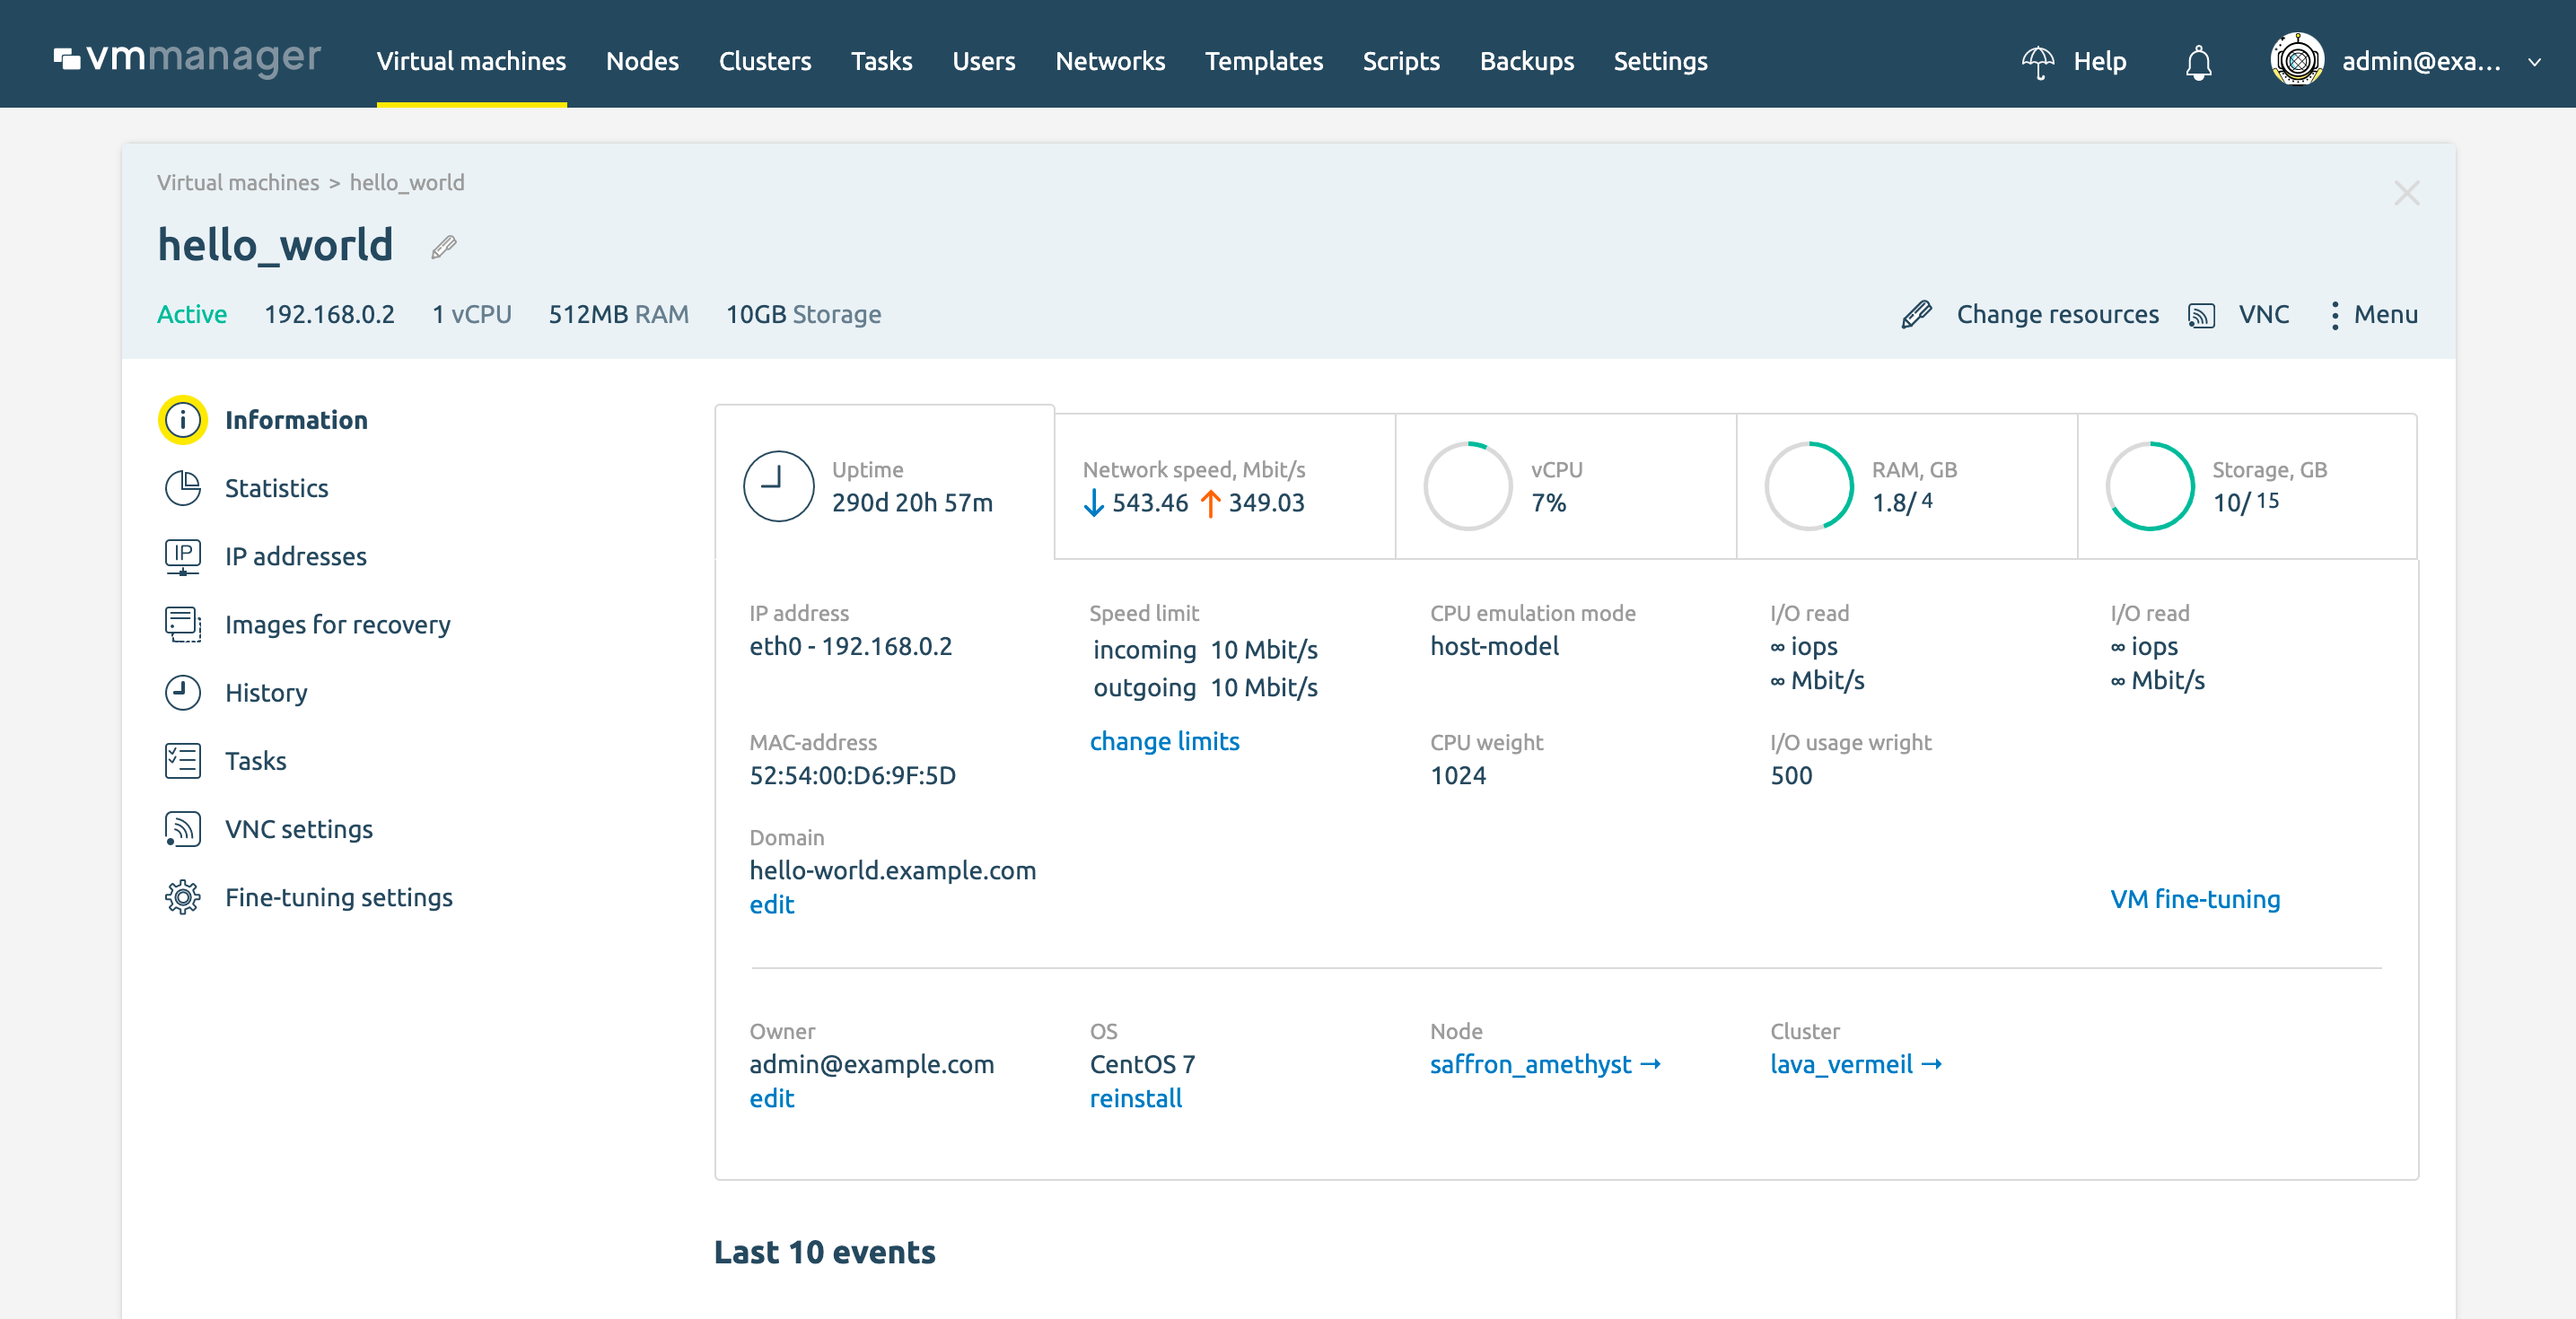
Virtual machine card
The card provides detailed information on all parameters of the virtual machine. You can view statistics for a specific period and analyze changes in the infrastructure. You can manage parameters of the virtual machine in the card:
- Network settings,
- Domain name,
- VNC connection parameters,
- Backups,
- Fine settings of the libvirt-domain: CPU weight, IO, traffic limits, equipment emulation mode
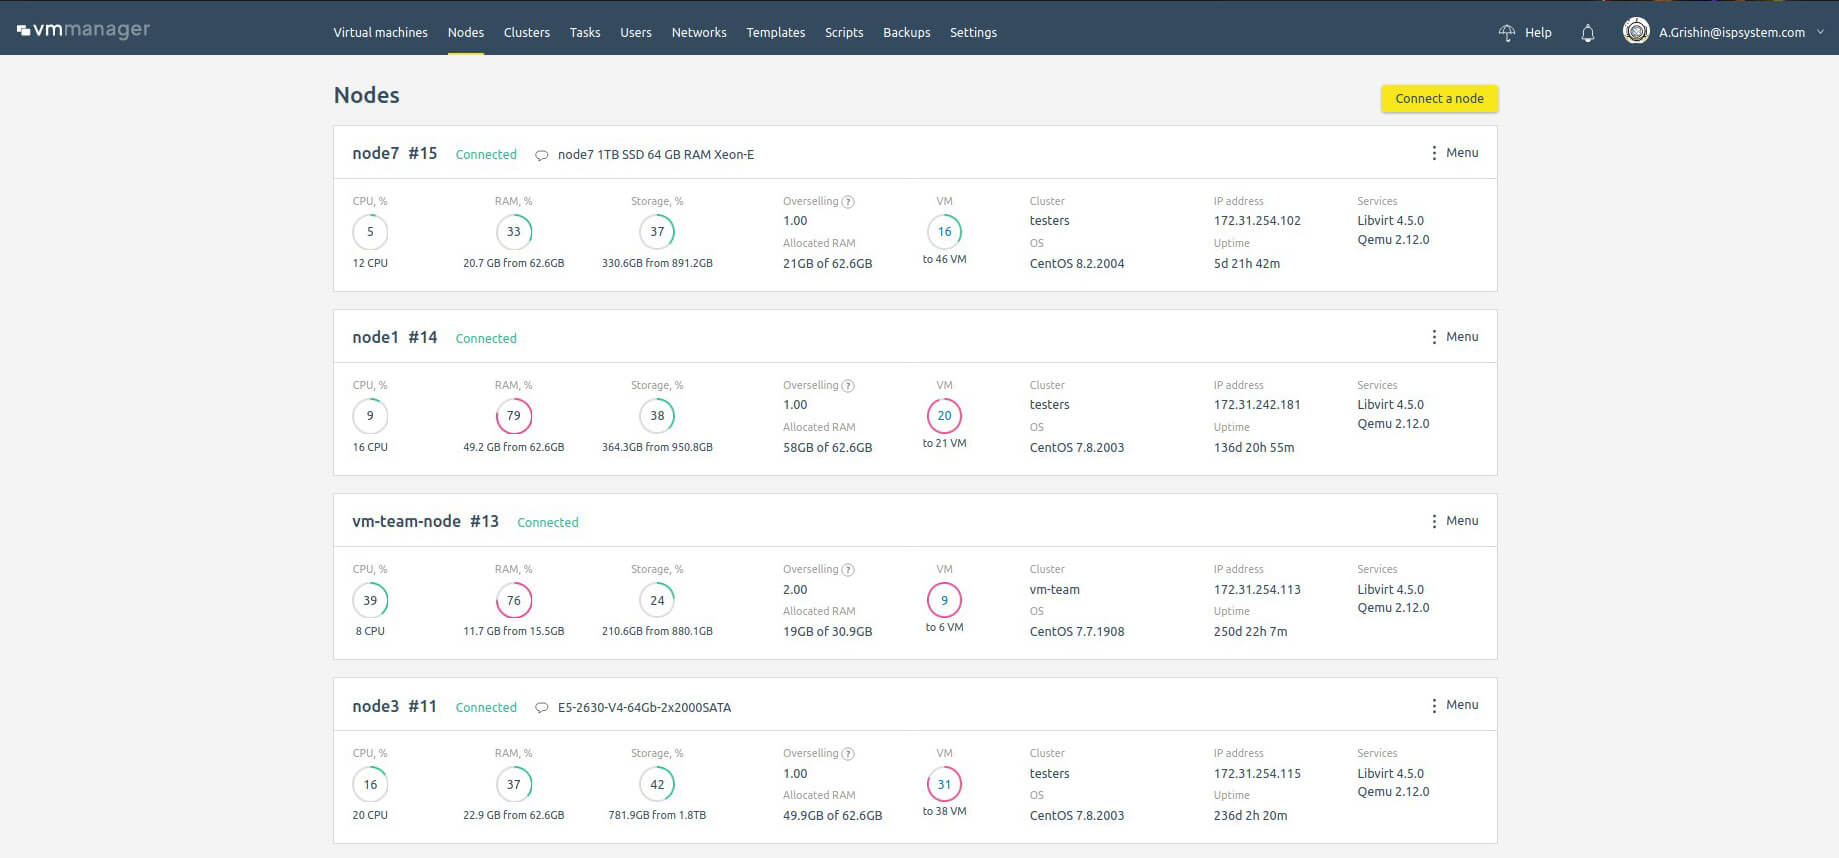
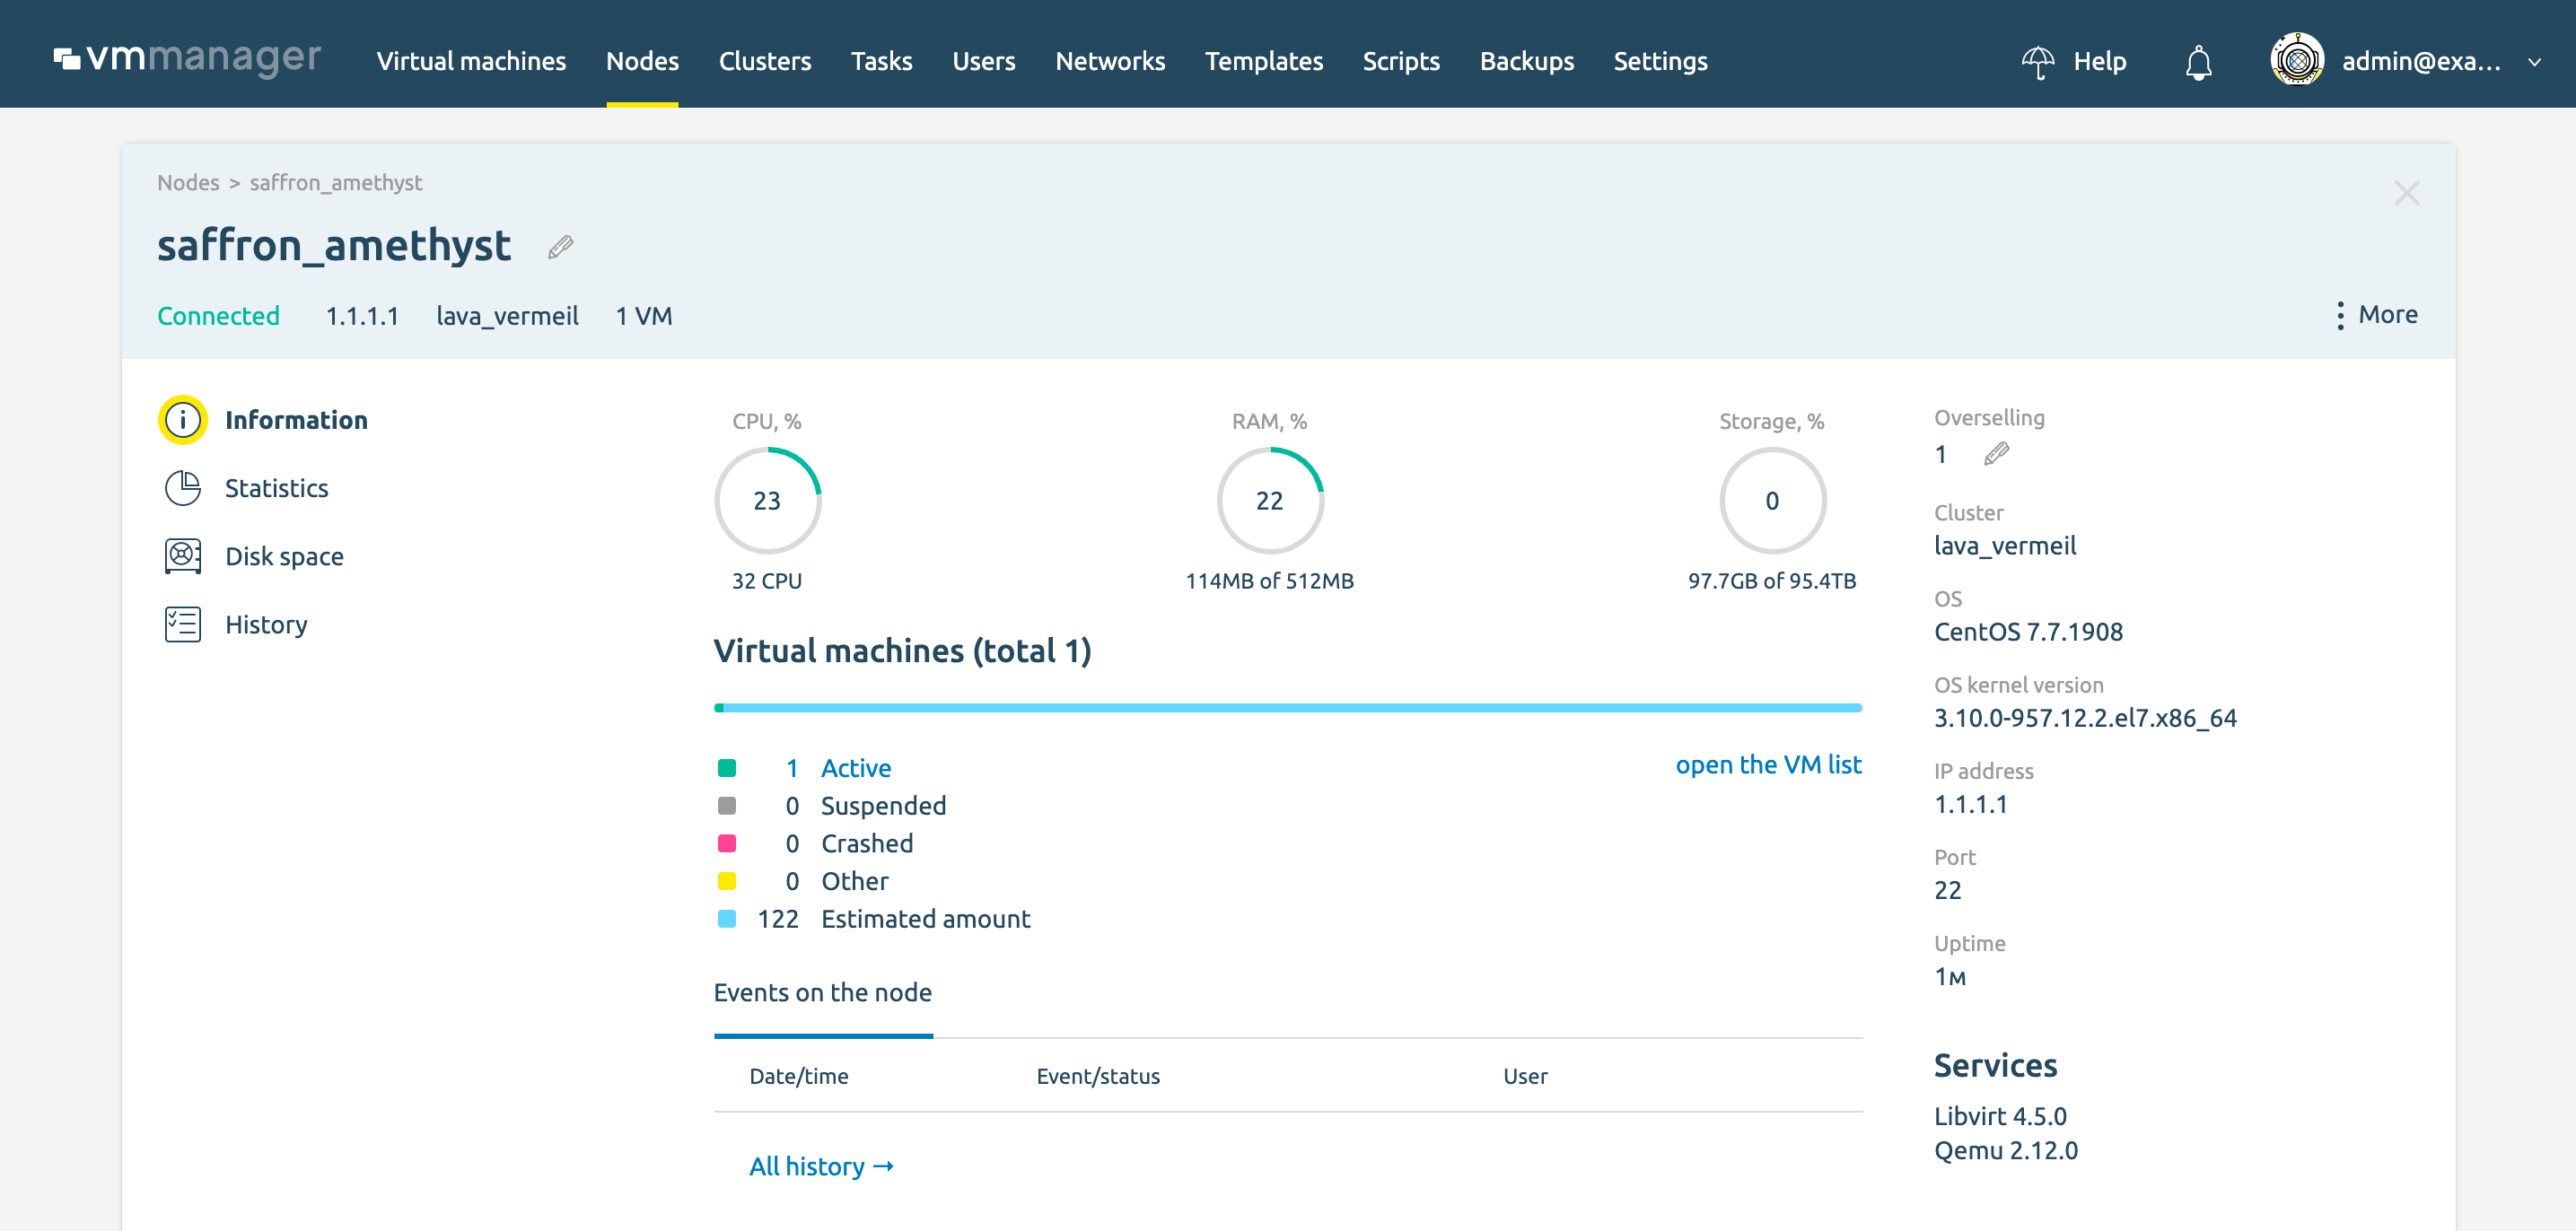
Node card
The node card contains data on the number of active, stopped, damaged virtual machines and a forecast of how many more VMs will the physical server approximately accommodate. This helps to better assess available physical resources and plan equipment purchases.
The change history records data on all recent events: their start time, duration, task status (in queue, ready, running), and the name of the user who started them. You can see which cluster the server belongs to and view guest VMs that run on specific hardware. All this helps to ensure transparency of business processes of the company.
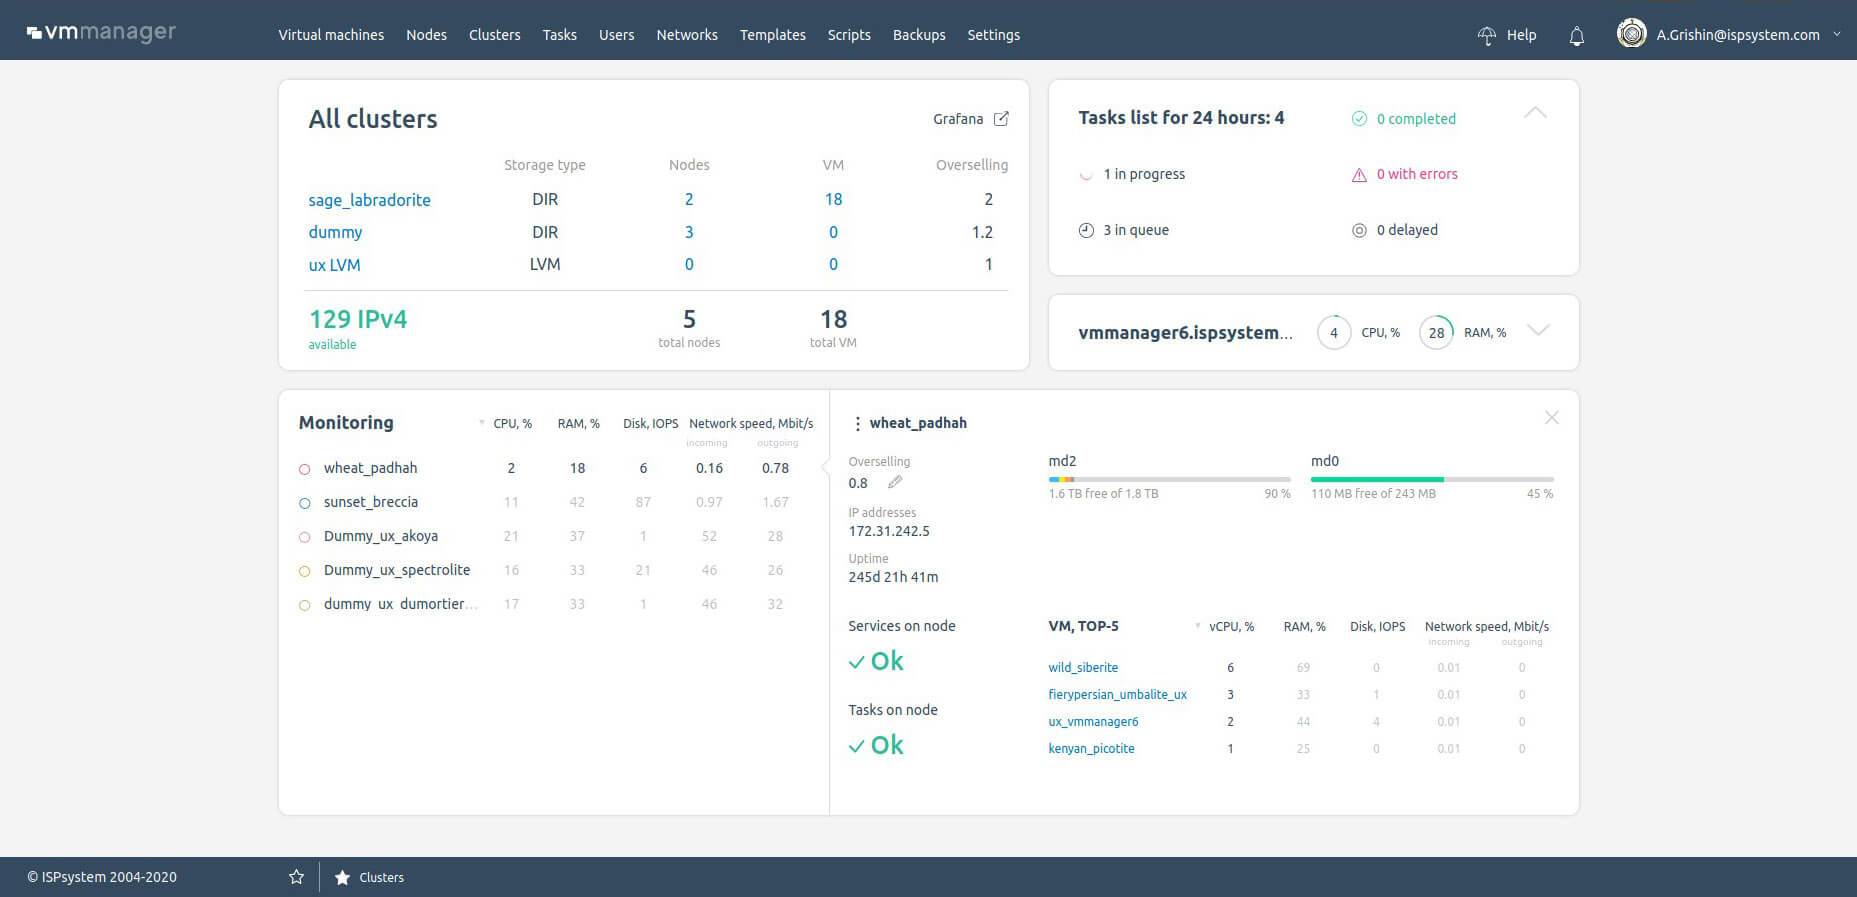
Dashboard
The main indicators of the system are collected on the dashboard. It can be displayed on a separate monitor in order to be able to quickly assess the current state of the infrastructure and react quickly to incidents.
New parameters are also provided here. For example, the platform self-diagnostic widget, cluster statistics, number of available IP addresses, VMmanager version and the product's change log.
There is the task list with breakdown by status: completed, in progress, pending processing, error.
You can view the top of the most loaded nodes and edit the overselling settings on them.
From the dashboard you can go to the task list, cluster, node or virtual machine to get closer to the problem and assess the situation in more detail.
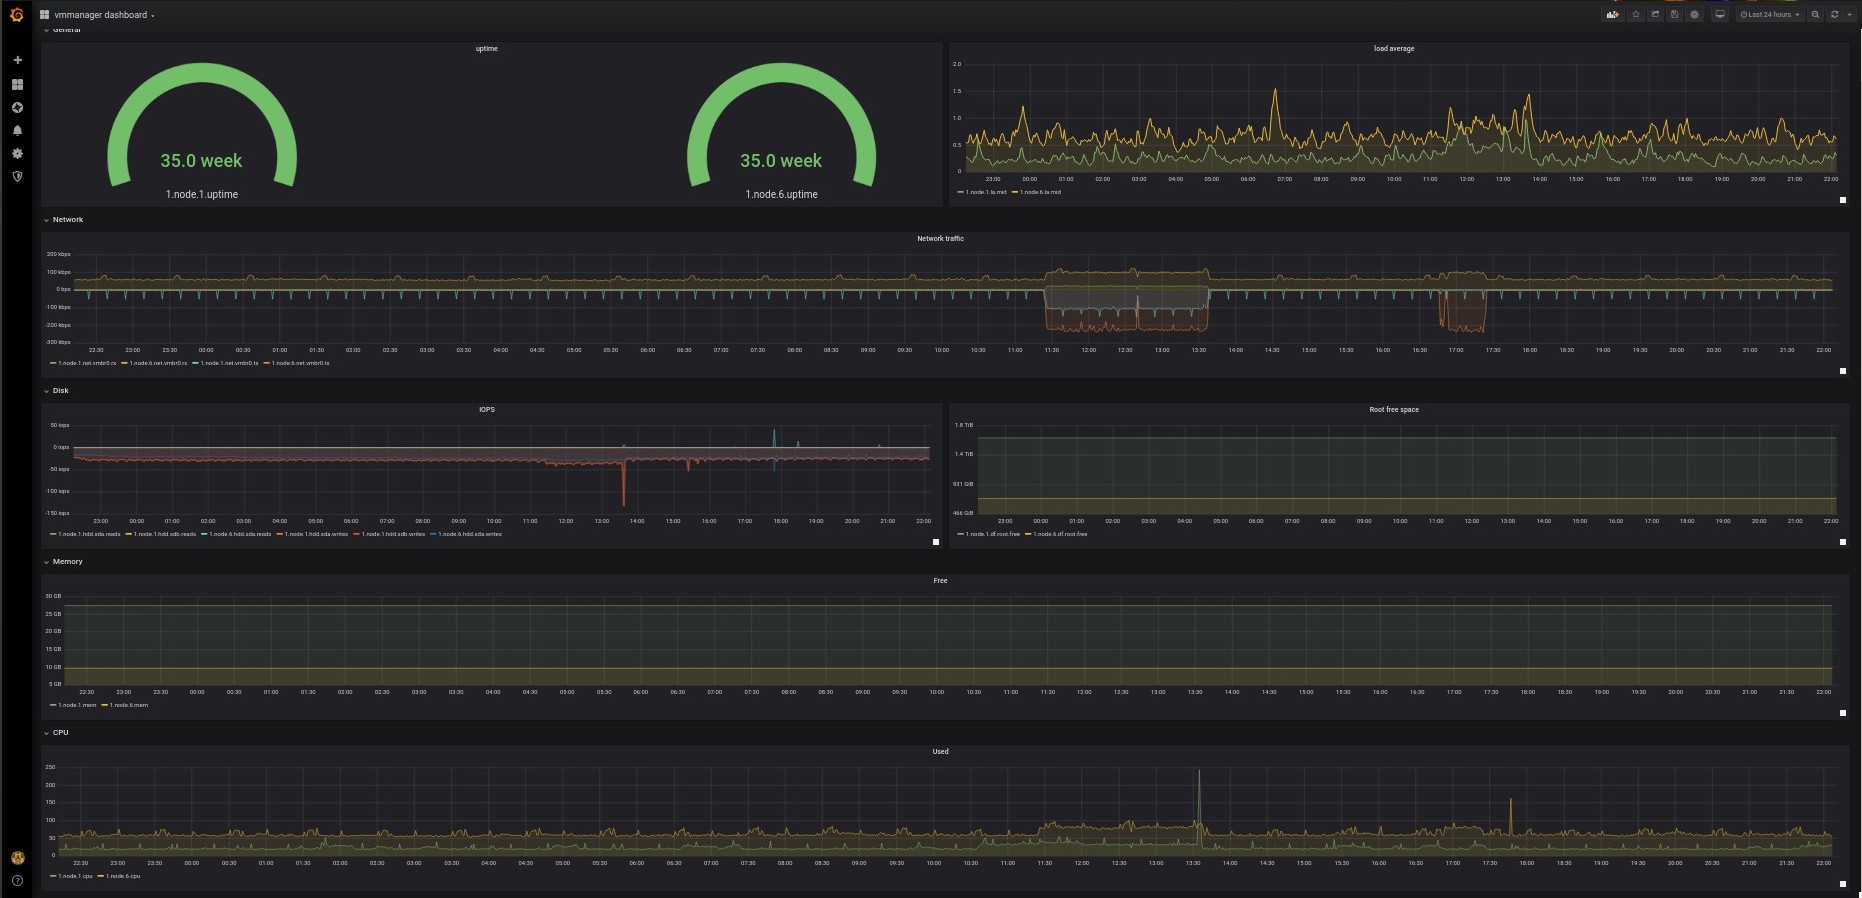
Grafana
Thanks to the integration with Grafana, you can flexibly customize visualization of parameters in the system, statistics and incident analysis.
It is an out-of-the-box ready-to-go container with Grafana complete with all integrations, database connections and a pre-configured demo dashboard. To deploy monitoring, you only need to create your own dashboard, choose the entity, parameters and method of visualization. Everything is configurable via a simple graphical interface in a couple of clicks. Read more details in our documentation: how to work with Grafana in VMmanager
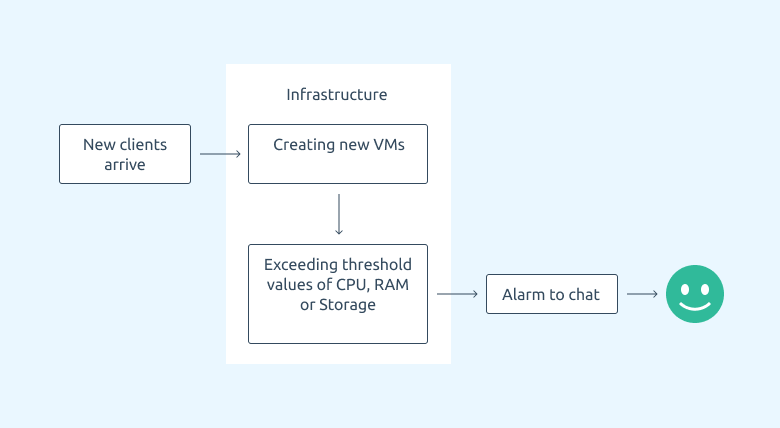
Notifications
The notification service helps to react to critical incidents in time. For example, if the provider fails to continue provisioning VMs via the billing system, a corresponding alarm will be sent immediately. Accordingly, prompt actions by professionals will minimize the negative impact on business.
The service allows for flexible setting of peaks and event parameters. Notifications can be configured in the service:
- Based on parameter: CPU, RAM, STORAGE, IOPS;
- Based on platform tasks: VM damage, server unavailability, errors in tasks on the server, reboot, errors of creating a VM, etc.
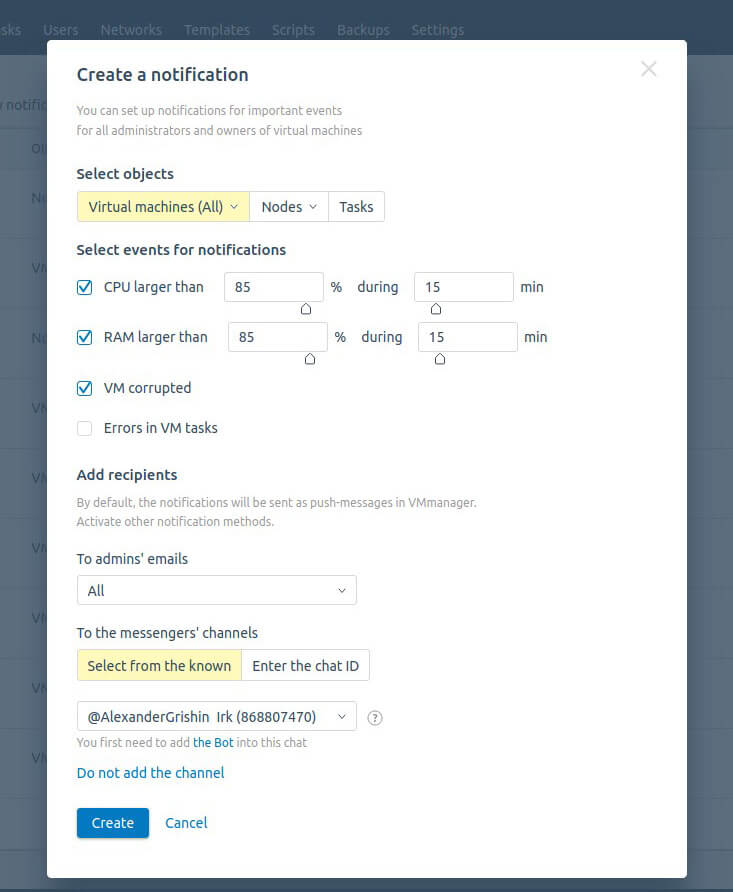
Notifications can be received in the product interface, by email and in Telegram. More details about the architecture of the service were shared by the Software Developer Dmitriy Syrovatskii in the article How we developed the notification service.
Our plans
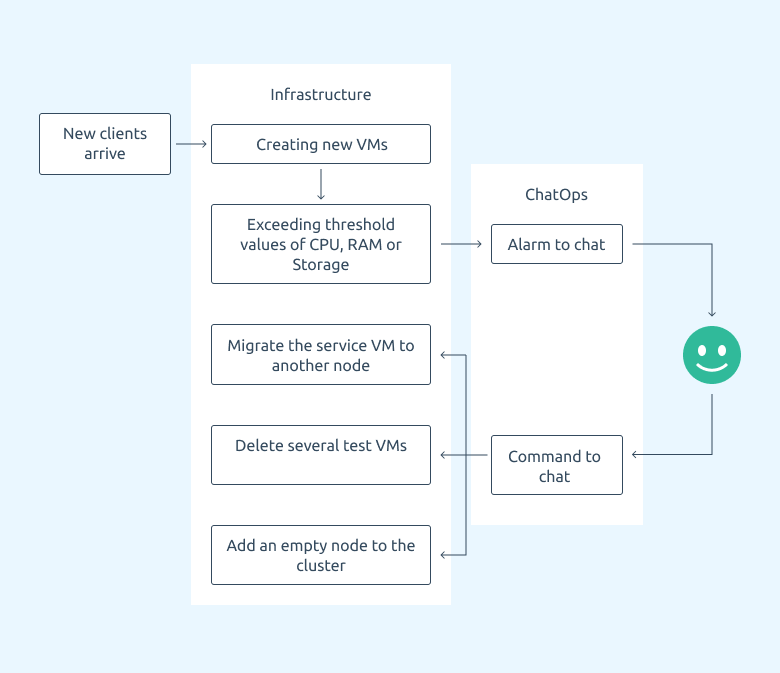
At present, in VMmanager, the ready-to-go system collects and visualizes data and reports on infrastructure events via email and Telegram. We plan to add such communication channels as Slack and Mattermost. However, so far it remains a one-way interaction without feedback or control capability.
What if we added a ChatOps system so you could manage your virtual infrastructure directly from messengers? This will allow solving operational tasks even in extreme situations, when full access to the platform is not available. Even if the system administrator is hiking in the mountains with nothing but a mobile phone, he/she will still be able to solve the problem with the server by simply sending the appropriate command via a messenger.
This brings us back to the question what is better for monitoring: a set of conditionally free tools with a high entry threshold and a long implementation cycle? Or a ready-to-go commercial product with simple implementation, user-friendly interface and competent technical support? I agree, this is a debatable issue.
However, my experience with the IT industry shows: business is much more likely to choose a ready-made commercial solution. A simple and straightforward tool, ready to benefit the company right now.
But what about physical equipment?
We recommend using VMmanager in conjunction with DCImanager — our physical hardware management platform. This will give you a powerful tool for monitoring your entire infrastructure and automating your processes.