

Today I will tell you how to configure Zabbix for your virtual infrastructure in VMmanager. This can be done in a few minutes: we have added ready-made Zabbix installation scripts to the platform repositories with the ability to set parameters when creating a virtual machine.
Zabbix is known to anyone who has ever been interested in monitoring. With it, you can find out about failures before users tell you about them. In addition, Zabbix is an open source software and it is distributed under the GNU GPL license. It does not require large financial investments and labor costs to maintain.
How to install a Zabbix server?
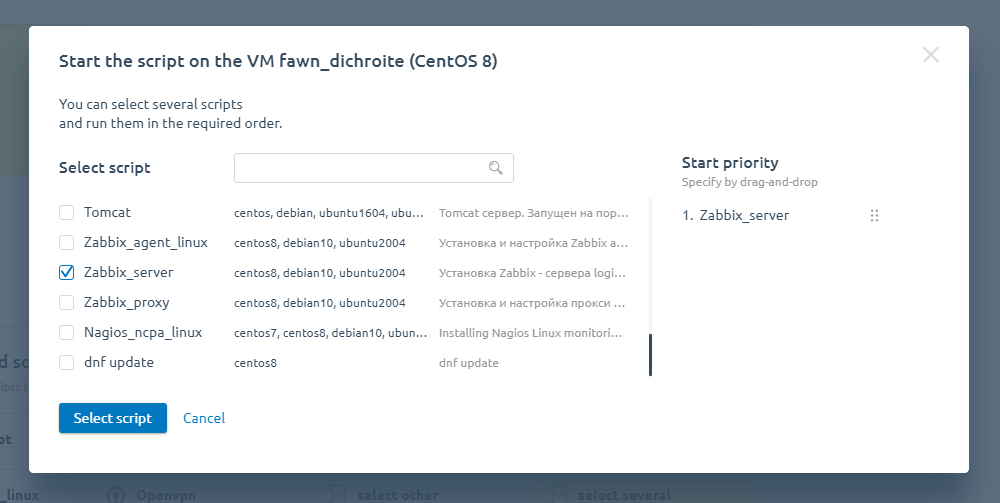
Create a virtual server on CentOS 8 \ Debian 10 \ Ubuntu 20.04. Consider the requirements to Zabbix server. When installing, specify the script Zabbix_server
After installing the virtual server, Zabbix will be available at: http://ip_of your vds. Login details:
Login: Admin
Password: zabbix
How to add a virtual server to the monitoring?
We now have a Zabbix server. But on its own it will only monitor the virtual server where it is installed. We, on the other hand, need to monitor key infrastructure objects. To do this:
- In VMmanager for the virtual server, run the Zabbix agent installation script and specify the IP address of your Zabbix server.
- After the script has finished, add your server to Zabbix.
Enter Configuration → Hosts → Create host.
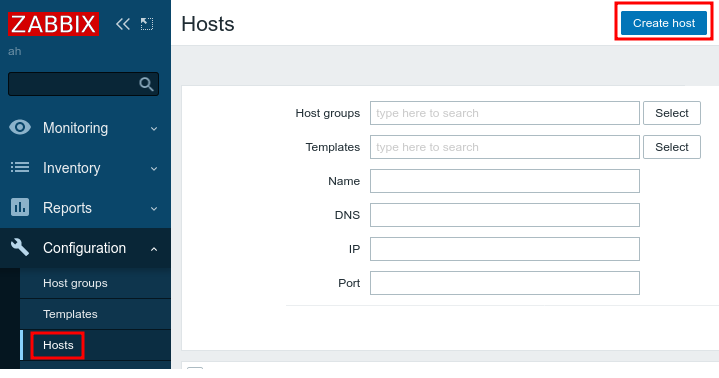
3. Add the VM settings:
- Host name — discretionary name for designation of the VM in the Zabbix database;
- Visible name — discretionary name for display of the VM in the Zabbix database;
- Groups — group of objects. Select Virtual machines;
- IP address — VM's IP address;
- DNS name — DNS server name. Leave the default value empty.
- Connect to — connection type. Select IP;
- Port — connection port. Leave the default value - 10050;
- Description — discretionary VM description;
- Monitored by proxy — proxy used. Select the name of the proxy, if you are using one:
- Enabled — enable this option to activate the monitoring of the VM;
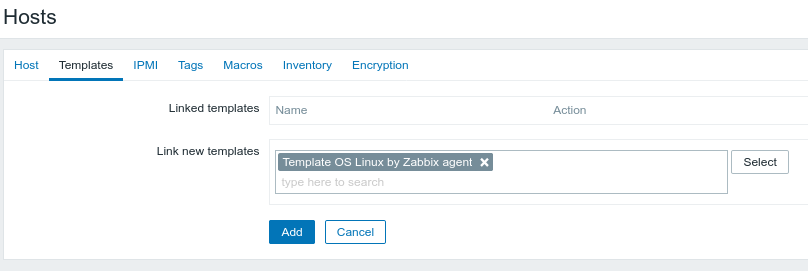
4. Go to the Templates tab and select the template for VM monitoring in the Link new templates field:
- with Linux family OS - Template OS Linux by Zabbix agent;
- with Windows OS - Template OS Windows by Zabbix agent.
Zabbix will now monitor various server parameters, such as disk space, amount of free RAM, etc.
In Zabbix you can set up notifications and reports, so you are always aware of problems in advance.
Configuration of Zabbix, documentation
Do you already have your own Zabbix server?
If you already have your own Zabbix server, you may have run into problems:
- How to monitor servers in different data centers in one place?
- How to reduce the load on the Zabbix server when there are too many servers monitored?
These problems are easy to solve - you need a Zabbix proxy to do it. The proxy itself monitors the servers that are connected to it and then passes the collected information in compressed form to the Zabbix server.
Zabbix proxy can be installed in the required location - allowing you to get monitoring of servers remote from our Zabbix server. Alternatively, you can divide the infrastructure into logical blocks to reduce the load on the Zabbix server.
Setting up a proxy in VMmanager 6 is also easy:
- Create a virtual server on CentOS 8 \ Debian 10 \ Ubuntu 20.04. Consider the requirements to Zabbix server.;
- When installing, specify the Zabbix_proxy script and the address of your Zabbix server.
After installation, add your new proxy to Zabbix:
1. Enter Administration → Proxies → Create proxy.
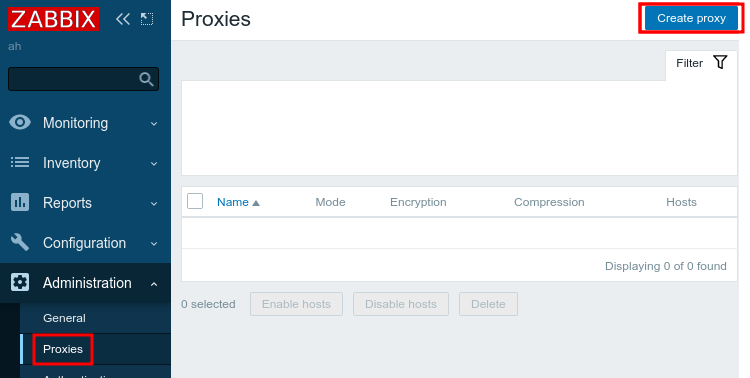
2. Specify proxy settings:
- Proxy name — discretionary proxy name.
- Proxy mode — proxy’s operating mode. Select Passiv.
- IP address — proxy's IP address.
- DNS name — DNS server name. Leave the default value - localhost.
- Connect to — connection type. Select IP.
- Port — connection port. Leave the default value - 10051.
- Description — discretionary proxy description.
Now, to add servers to monitoring, choose your proxy IP address when you install the agent script.
If you have VMmanager, try installing monitoring already at this point. And if you prefer Nagios, we also have scripts to install the Nagios Cross Platform Agent (NCPA).
Try VMmanager to manage your virtual infrastructure.
VMmanager is a virtualization platform based on KVM/LXD. VMmanager automates the management of virtual resources:
- allows you to automatically deploy virtual machines with preinstalled software and preconfigured parameters;
- includes out-of-the-box systems for monitoring and backups;
- provisions virtual resources in a few seconds;
- allows the use of floating IP addresses that can be reassigned to different nodes in the cluster;
- works out of the box and does not require funds for development or support.