En
En
 Es
Es
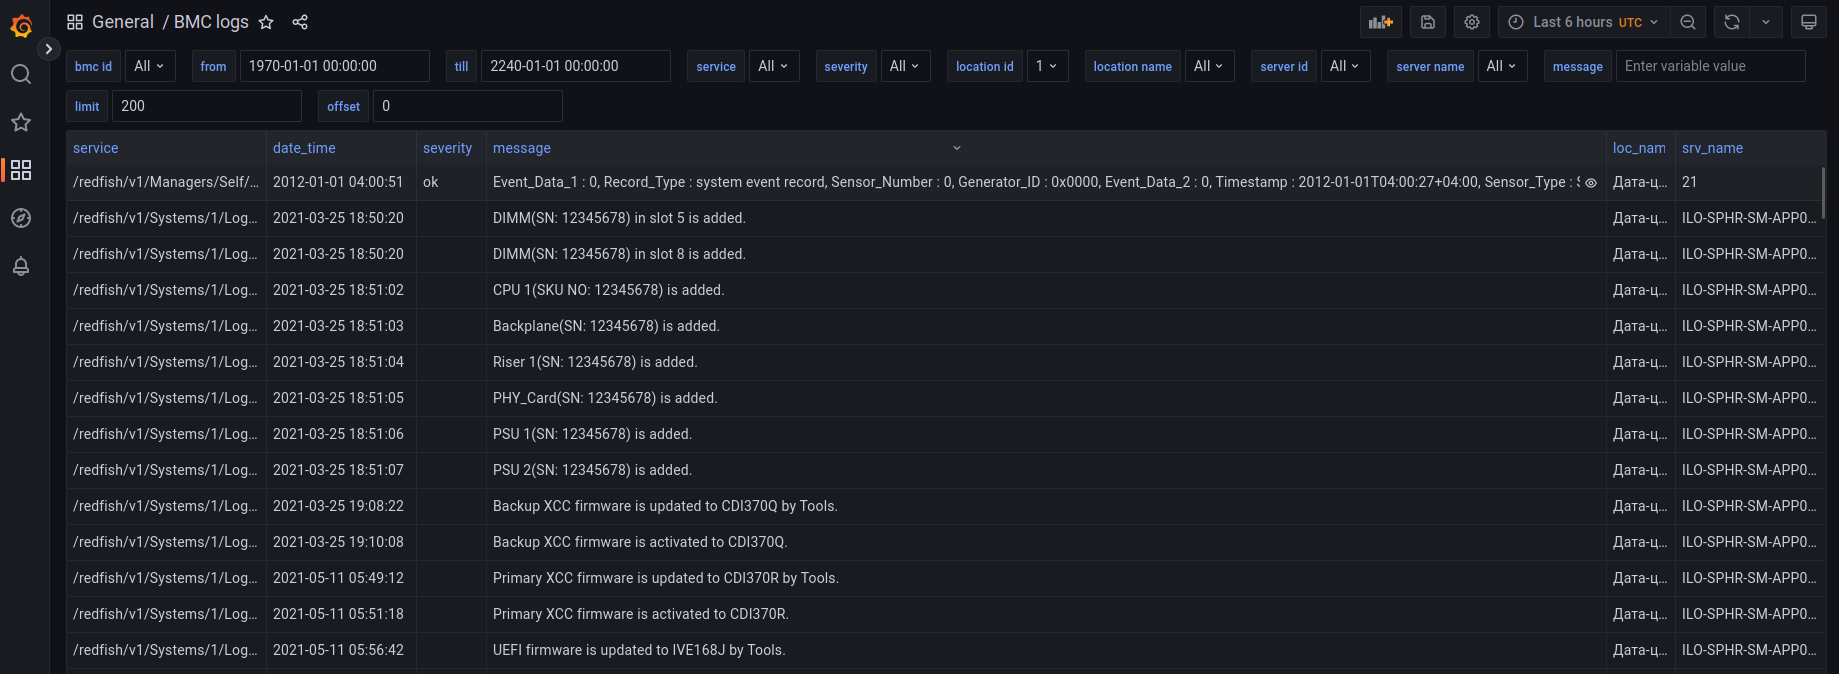
Eventlog contains log files obtained when polling servers with the Redfish BMC. You can view Eventlog in Grafana's built-in monitoring system. A separate dashboard BMC logs is created in Grafana for Eventlog.
To enable Eventlog, go to the platform homepage → select a location → click All Settings → enable the Allow log transfer to Grafana for servers with BMC → click Apply.
To open Eventlog, go to the Servers → Common Eventlog link. Eventlog will open in a separate tab. You can filter the log by desired criteria.