 En
En
 Es
Es
The Resources by statistics section displays:
- in the client's personal area — all services with resource statistics add-ons ordered by the client, regardless of consumption level;
- for provider employees — services for which the consumption of resources by add-ons:
- exceeded the set limit (overage);
- approaches the limit from the global settings.
The section allows you to view resource information, but not to change it. For more information on how to customize resources, see Billing type.
The section data is updated throughout the month. On the first day of each month, the list of services is cleared.
Logic of operation
For the client, the platform includes in the list all services that have add-ons with statistics, regardless of resource consumption level.
For provider employees, the platform includes a service in the list if for its add-on:
- overage is recorded for the current date (consumption is more than 100% of the limit);
- consumption has reached the alert limit set in the global settings. To configure the Threshold for sending notifications, go to Provider → Global settings → Statistics-based section. For more details, see Global settings article.
If a service has several add-ons that are overage or close to the limit:
- a separate row for each add-on will be displayed for the provider's employees;
- for the client, a specific service will be displayed with the option to expand the row and see all add-ons.
The data in the rows are updated daily. If the summation of values for a month is enabled in the statistics settings for a service with several parameters, the resource utilization for each of the parameters will be displayed (sum of parameters). If the Maximum value is selected for a service, the resource utilization will be displayed only for the parameter that has reached the highest value. For more details on the settings, see About tariff plan configuration article.
Services with Ordered status are not included in the section.
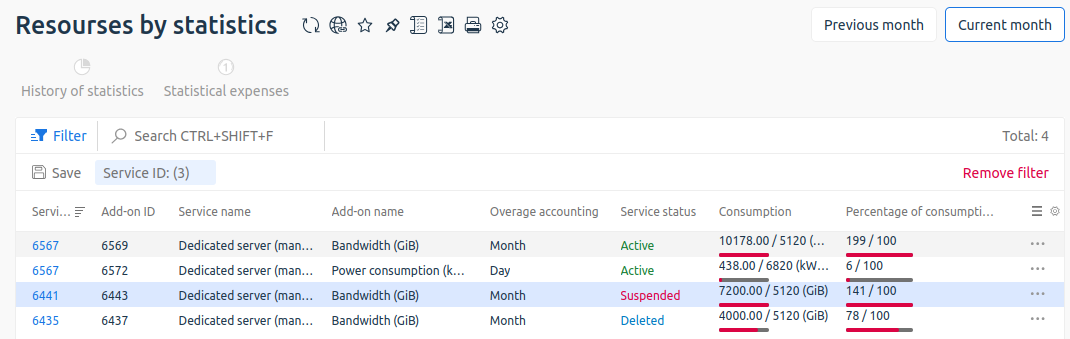
Provider-side display
To view the contents of the section, go to Resource consumption → Resources by statistics in the left menu. You can see:
- Statistics history — click to open the page with the history of resource consumption for the selected service. For more details, see the article Service utilization statistics;
- Expenses by statistics — click to open the list of expenses by service. The list will be filtered by service id and Statistics operation.
On the top of the page you can select the period of data display:
- Previous month;
- Current month.
The table of services contains columns:
- Service ID — link to the service card. Opens the list of services with filter by this ID;
- Add-on ID — a unique identifier of the service add-on;
- Client — the name of the client-owner of the service;
- Service name — name of the tariff plan of the service;
- Add-on name — the name of the resource with units of measurement. For example, “Bandwidth (GiB)”;
- Overage count — the value by which the overage is counted. For example, month or day;
- Service status — current status of the service. For example, “Active”, ‘Suspended’, “Processing”, etc. The status “Ordered” is not displayed;
- Consumption — actually used volume of the resource as of the reporting date / resource limit set in the tariff or service, with units of measurement. For example, “6320 /5120 (GiB)”;
- Percentage of consumption — the estimated percentage of resource utilization. Calculated by the formula:
(Current value / Threshold value) * 100%
Rounded to whole numbers according to the rules of mathematics: if the fractional part of the number is less than 0.5, it is rounded down, if 0.5 or more - up; - Cost of overrun per unit — price per unit of resource over the limit. It is taken from the tariff, service or special price. It is specified with the client's account currency. Not displayed if the price is not set.
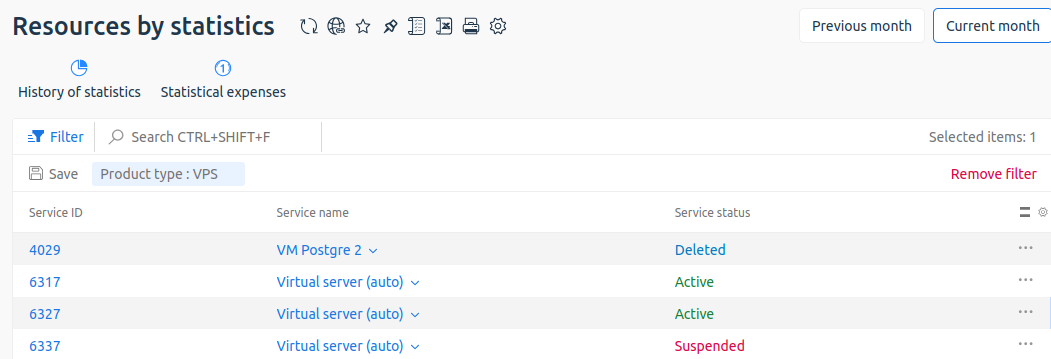
Client-side display
To view the contents of the section, go to Resource consumption → Resources by statistics in the left menu. You can see:
- Statistics history — click to open the page with the history of resource consumption for the selected service. For more details, see the article Service utilization statistics;
- Expenses by statistics — click to open the list of expenses by service. The list will be filtered by service id and Statistics operation.
On the top of the page you can select the period of data display:
- Previous month;
- Current month.
The table of services contains columns:
- Service ID — link to the service card. Opens the list of services with filter by this ID;
- Service name — name of the tariff plan of the service;
- Service status — current status of the service. For example, “Active”, ‘Suspended’, “Processing”, etc. The status “Ordered” is not displayed;
- Total amount — estimated amount payable for the excess in the customer's currency. service plan;
Diagnostic
If a service is not displayed in the list, make sure that:
- it does not have a status of "Ordered";
- statistic accounting is enabled for the add-on service and an overage has been recorded or the overage warning threshold has been reached;
- the section filters do not hide the service;
- the overage occurred before the day you are viewing the statistics. For example, if the overage was recorded on 15.07.2025, the data on it will be displayed on 16.07.2025.